Request for hardware

Update: I want to thank everybody that has offered a way to access such a netbook. We now have access to the needed hardware and are trying to fix the bug as soon as possible! Much appreciated.

Do you have a netbook (from around 2011) with AMD processor, please take a look if it is bobcat processor (C-30, C-50, C-60, C-70, E-240, E-300, E-350, E-450). If you have one and are willing to help us giving vpn/ssh access please contact me (hverschore [at] mozilla.com).

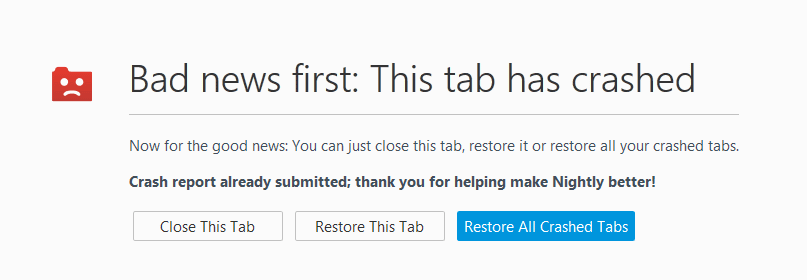
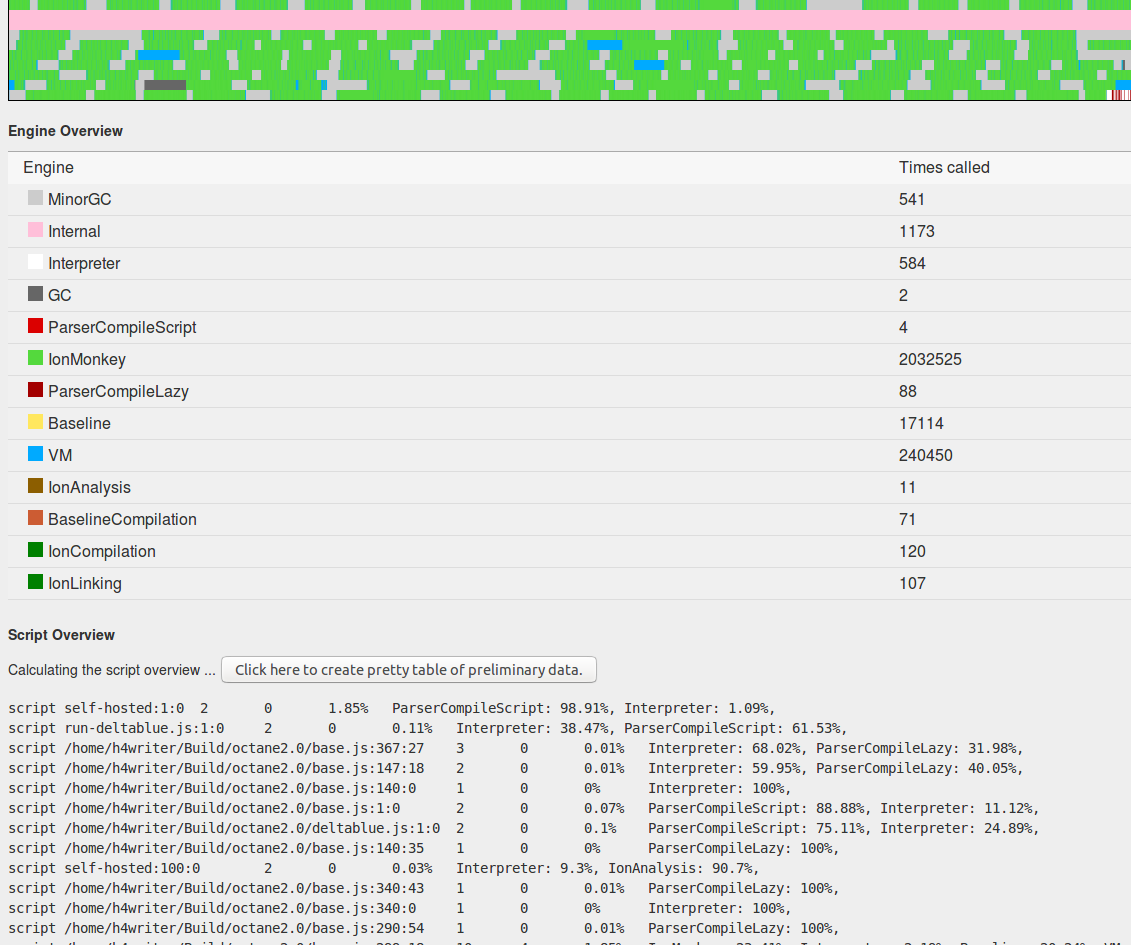
Improving stability and decreasing crash rate is an ongoing issue for all our teams in Mozilla. That is also true for the JS team. We have fuzzers abusing our JS engine, we review each-others code in order to find bugs, we have static analyzers looking at our code, we have best practices, we look at crash-stats trying to fix the underlying bug … Lately we have identified a source of crashes in our JIT engine on specific hardware. But we haven’t been able to find a solution yet.

Our understanding of the bug is quite limited, but we know it is related to the generated code. We have tried to introduce some work-around to fix this issue, but none have worked yet and the turn-around is quite slow. We have to find a possible way to work-around and release that to nightly and wait for crash-stats to see if it could be fixed.

That is the reason for our call for hardware. We don’t have the hardware our-self and having access to the correct hardware would make it possible to test possible fixes much quicker until we find a possible solution. It would help us a lot.

This is the first time our team tries to leverage our community in order to find specific hardware and I hope it works out. We have a backup plan, but we are hoping that somebody reading this could make our live a little bit easier. We would appreciate it a lot if everybody could see if they still have a laptop/netbook with an bobcat AMD processor (C-30, C-50, C-60, C-70, E-240, E-300, E-350, E-450). E.g. this processor was used in the Asus Eee variant with AMD. If you do please contact me at (hverschore [at] mozilla.com) in order to discuss a way to access the laptop for a limited time.

Performance improvements to tracelogger

Tracelogger is a tool to create traces of the JS engine to investigate or visualize performance issues in SpiderMonkey. Steve Fink has recently been using it to dive into google docs performance and has been hitting some road blocks. The UI became unresponsive and crashing the browser wasn’t uncommon. This is unacceptable and it urged me to improve the performance!

Crash

I looked at the generated log files which were not unacceptable large. The log itself contained 3 million logged items, while I was able to visualize 12 million logged items. The cheer number of logged items was not the cause. I knew that creating the fancy graphs were also not the problem. They have been optimized quite heavily already. That only left the overview as a possible problem.

The overview pane gives an overview of the engines / sub parts we spend time in. Beneath it we see the same, but for the scripts. The computation of this runs in a web worker to not make the browser unresponsive. Once in a while the worker gives back the partial result which the browser renders.

The issue was in the rendering of the partial result. We update this table every time the worker has finished a chunk. Generating the table is generally fast for the workloads I was testing, since there weren’t a lot of different scripts. Though running the full browser gave a lot of different scripts. As a result updating the table became a big overhead. Also you need to know this could happen every 1ms.

The first fix was to make sure we only update this table every 100ms. This is a nice trade-off between seeing the newest information and not making the browser unresponsive. This resulted in far fewer calls to update the table. Up to 100x less.

The next thing I did was to delay the creation of the table. Instead of creating a table it now shows a textual representation of the data. Only upon when the computation is complete it will show the sortable table. This was 10x to 100x faster.

Screenshot of tracelogger

In most cases the UI is now possible to generate the temporary view in 1ms. Though I didn’t want to take any chances. As a result if generating the temporary view takes longer than 100ms it will stop live updating the temporary view and only show the result when finished.

Lastly I also fixed a memory issue. A tracelog log is a tree of where time is spend. This is parsed breadth-first. That is better since it will give a quite good representation quite quickly, even if all the small logged items are not processed yet. But this means the UI needs to keep track of which items will get processed in the next round. This list of items could get unwieldy large. This is now solved by switching to dept-first traversal when that happens. Dept-first traversal needs no additional state to traverse the tree. In my testcase it previously went to 2gb and crashed. With this change the maximum needed memory I saw was 1.2gb and no crash.

Everything has landed in the github repo. Everybody using the tracelogger is advised to pull the newest version and experience the improved performance. As always feel free to report new issues or to contribute in making tracelogger even better.